Introduction
Forecasting: where to now? We live in times of unparalleled data availability and data awareness. And yet, as the Ancient Mariner might have said, there is data everywhere “… but not a drop to drink!” Having information at our fingertips is one thing. Knowing how best to navigate it is another altogether. What should our expectations be? Where to now with forecasting? Let’s first take a step back to assess some success stories. Here are some examples to highlight the remarkable progress that has been made in recent years.
Forecasting hits
Facial recognition
No longer the stuff of dreams (“Minority Report”, anyone?), forecasting in the form of facial recognition is now here to stay. It solves a problem in a clear and intuitive way. Each face carries, by and large, the same extensive set of features. Yet, the combination of the features themselves is unique. The shape of the training set is consistent and it is clear to see how this technology can be applied.
Autonomous driving
Again, autonomous driving is here to stay, although we can expect to wait several years until their use is widespread. The hurdles to further adoption have more to do with regulatory approval than technical limitations (though these still exist). Moreover, such cars do not need to be perfect, they just to be better than us! For instance, a 2016 report from a Pittsburgh law firm estimated that between 94% and 96% of crashes were due to driver error.
If automated driving can improve on this then there will be a clear safety dividend. Technically we not only have established algorithms (and even commonly available data sets) but also ways to further fine-tune their application e.g. by using captcha inputs to train AI.
Recommender systems
Now the water starts to get a little murkier. The technology is well established – just look at the books that tackle this topic – but nonetheless current implementations often leave a little to be desired. Look at this screenshot taken from my iphone, where a music app is recommending some content. The two albums shown are already in my music library; I have even downloaded both of them as well! The recommendations I get on similar services seem to be more rudimentary than we would expect.

But what these three examples above have in common is that we can intuitively and clearly define the problem we are wanting to solve. The implementation may not be simple, but we have a good understanding of what steps a model is taking when reaching a solution.
…and forecasting misses
And then there are the misses! For a little light-hearted fun I searched for some classic “wrong-casts”. It didn’t take more than a minute or two to find the following:
For starters, here is Decca Records in 1962, on why they didn’t sign the Beatles:
“We don‘t like their sound and four-piece groups with guitars, particularly, are finished”
And here’s Ken Olsen, co-founder of Digital Equipment Corp., opining in 1977 as to the future of PCs:
“There is no reason anyone would want a computer in their home”
Microsoft, notably, bet against this line of thinking with astonishing success. But even they were not above making an absolute clanger or two. Steve Ballmer in 2007 on the iPhone:
“[The iPhone] is the most expensive phone in the world and it doesn’t appeal to business customers because it doesn’t have a keyboard which makes it not a very good e-mail machine…”
Rocket mail
My personal favourite, though, is Rocket-Mail. Here is Arthur Summerfield, U.S. Postmaster General (1959) to explain:
“Before man reaches the moon, your mail will be delivered within hours from New York to Australia by guided missiles. We stand on the threshold of rocket mail”
According to Wikipedia, this did actually get off the ground (no pun intended):
“In the same year Summerfield made his bold statement, the U.S. Post Office tested “Missile Mail” for the first and last time. A rocket was launched from the submarine Barbero off the coast of Florida to a naval base in Mayport. The entire trip lasted 22 minutes, and the two mail containers it carried were delivered successfully. Sadly, the program was never implemented”
Interestingly, RocketMail was the name given to one of the early email engines, which was later acquired by Yahoo! in 1997, becoming Yahoo Mail.
These are all cases where the “wrong-casting” had more to do with extreme technical and societal flux, than with any bias, conscious or otherwise. But we can still maybe identify some habits or misunderstandings that we would do well to notice.
The narrative fallacy
Coined (I think) by Nassim Table in his book “Black Swan”, the narrative fallacy refers to a tendency to overlay a story on a set of facts to make them more meaningful. It’s clear why we would do that. In order to process, prioritize and remember the flood of information heading our way, we use a “story” to bring sense and meaning to otherwise disparate facts. But therein lies the weakness. In overlaying a commentary on our data, we make it harder to see what information we have filtered out, and where we are open to cognitive bias. For instance, this sentence contains two facts that may or not be related:
“My cousin recently got a young puppy. My dog barked at our cousin’s dog because he’s jealous”.
The two facts are: “my cousin recently got a young puppy”, and “my dog barked at the puppy”. Imposing a reason on those two facts – that the barking has to do with jealousy – may make the encounter more memorable. It may even fit in with previously observed behaviour on the part of my dog, or…it may just be what dogs do. In reaching my conclusion about the causality, I have excluded other possibilities.
We can partly guard against this tendency by adapting an empirical approach – collecting data, making predictions and drawing observations – and by insisting on falsifiable conclusions.
Naive trend extrapolation
At the other extreme, there sometimes exists a reluctance to impose an overly simple model on our data, because it is not “intelligent” enough. It’s as if one would rather be often wrong in the short term and eventually right, than correct in the short term and eventually wrong. But there is nothing unacceptable in having a naïve yet useful model if it fits the current need!
The M-competitions (see my blog article) illustrate how it has often proved to be the simpler, statistical algorithms rather than deep learning that been more effective at forecasting tasks.
Unknown unknowns
Sometimes we observe a pattern that looks sustainable, only to then see that reality proves otherwise. Here is an innocent-looking graph where the predictions (dark blue line) appear to map nicely onto the observed data (light blue line).
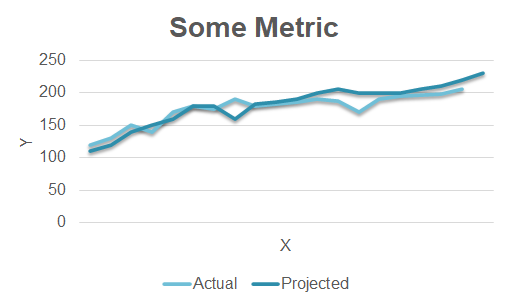
It’s maybe tempting to extrapolate our predicted values into the future for the purposes of forecasting something. But appearances can sometimes deceive. If in fact the line plots a measure of something that is potentially extremely unstable – e.g. winnings on repeated visits to casinos in Las Vegas – then the recent past is of no value in predicting the approaching future:
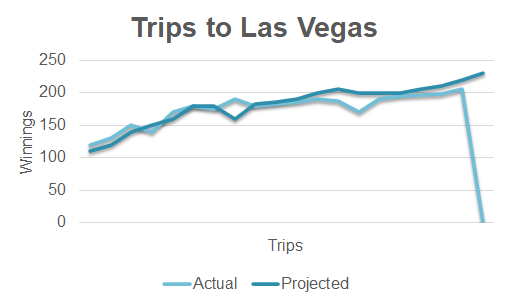
In other words, not everything that looks like a time-series pattern, actually is one.
Forecasting traps
Time series
As mentioned in the previous paragraph, the past sometimes only offers limited value. For instance, no sports professional assumes that records in their discipline will never again be broken. Absence of evidence is not evidence of absence. That which we have not measured or observed is not that which cannot be observed. And so on.
Optimization
Optimization is not only a question of efficiency, but also of redundancy. Software running as a distributed service on a cluster is not “efficient” as it is more complex and costs more, but certainly is efficient if it guards against failure or downtime. In the context of forecasting this means at least two things:
- Optimize at the right scale: finetune micro-processes for efficiency, and then combine into macro processes with sufficient built-in redundancy
- Prioritize robustness against failure over maximizing process output
Risk vs. ruin
One of advantages of not becoming over-exposed to a single aspect of efficiency is that it becomes clearer when predictive power should give way to protective measures. When my home was built several years ago, we discovered that the location was in a higher-than-average snow zone. Did I pore over weather charts from the past in an attempt to predict the statistical likelihood of us ever experiencing an extreme snow event? No – I just made sure my house insurance had the right option included so that said events would be covered. At times it just makes more sense to protect against unforeseeable events than to attempt to predict their onset.
One particular danger in the area of machine learning is of making a wrong assumption about data distribution. Many things in life – like peoples’ height – follow a normal, or gaussian distribution. Other things – such as personal wealth – do not. This has a bearing on how much data we need to measure until we can be sure what defines an outlier event. A pareto distribution (such as wealth) has an average value that is far more sensitive to measurements that are at the extreme end of the distribution but which still occur within the realm of “normality”. It can be catastrophic to define an anomaly in terms of a gaussian-based standard deviation, when in fact the data has a very different distribution.

Forecasting with open models
I’ve mentioned this before, but I’m old enough to remember going into department stores in London in the 70s and seeing the ever-present store employee standing diligently in the lift with us. Of course we could operate the buttons ourselves, but we had more unquestioning – and unconscious – faith in the mechanics of the elevator if someone was standing in there with us. We hardly see that now, as lift safety – whilst not 100% – is simply assumed.
Likewise with forecasting models: their complexity should not mean that we afford them premature trust. Models should be “open”, inviting us to examine their inner workings and revealing reality, not obscuring it. Kick the tires. Be empirical. Treat them as valuable tools, not as delegatees.
Peer pressure
This goes for frameworks, too. They are tools to use, not trophies to mount on your fireplace to show that you are keeping up with your competition. Just because everybody else is apparently adopting said technology, doesn’t mean that the time is necessarily right for you. About 10 years ago I was working on a large Hadoop project, one of the first of its size in Germany. We wrote most map-reduce jobs in java as SQL-based tools like Hive had not yet reached maturity. Our expectation was that, being able to process data at a scale not previously possible, this was groundbreaking stuff. Gartner stated around that time:
Big data analytics and the Apache Hadoop open-source project are rapidly emerging as the preferred solution to address business and technology trends that are disrupting traditional data management and processing. Enterprises can gain a competitive advantage by being early adopters of big data analytics.
However, fast-forward just half a dozen years, and the same people are reporting something rather different. Gartner again, this time in 2017:
Hadoop distributions are deemed to be obsolete before reaching the Plateau of Productivity because the complexity and questionable usefulness of the entire Hadoop stack is causing many organizations to reconsider its role in their information infrastructure.
Time your adoption of a new tool based on your own specific needs, not that of the market as a whole.
Quick summary
Let’s conclude this check-list section with a few bullet point take-aways:
- Don’t delegate away decision making to a tool
- Don’t delegate away your core-busines: no-one knows your process data better than you
- Start small and start visual, adopting an empirical and iterative approach
Forecasting use-case: anomaly detection
What bearing does all this have on a specific forecasting use-case? We have said that we want our model to reveal rather than obfuscate. If we have multivariate data, then the chances are high that, whatever patterns and dependencies are contained within our data, they will best understood by examining our data from different perspectives. So – in the context of anomaly detection – let’s talk about anomaly measurements rather than detection. We want maximum transparency that delays a consolidated/black-box view on things, until we can trust our model. This will mean we will work iteratively and, yes, that will be a little more involved and hands-on than if we simply set “forecast=true” and stand back and wait for our instructions.
Different perspectives, different models
What do I mean by observing our data from different perspectives? Something like this:
- For univariate data (i.e. we look at individual variables in isolation) we can conduct an inline, statistical analysis e.g. wave spectrum processing. This requires little data as the algorithms will applied to a moving window of data. For example, using:
- Fast Fourier Transforms
- Exponential smoothing
- For multivariate data, we can adopt an ensemble of predictor classes as mentioned here. We can also perform a similar analysis by using an algorithm called IsolationForest, which partitions data until all points are isolated, the number of partitions needed to isolate a particular point being a measure of its “clustered-ness”. Data points that can be isolated with just a few partitions will therefore be outliers. These two approaches offer slightly different approaches to solving the problem the same way: the predictor ensemble tries to maintain structuredness across scale, whereas the isolation forest examines structuredness by looking at clustering. So we have:
- Isolation Forest
- Ensemble of Predictors
- Also for multivariate data – we can use neural networks, with a twist. The twist being that we can combine visual elements of our data (in the sense that a curve is a 2D picture) with a time-series analysis. I’m planning to cover this in a separate article.
- Convolutional Neural Networks (CNN)
- Combination of CNNs with Recurrent Neural Networks: ConvLSTM, CNN+LSTM
Summary
So we have something like this:
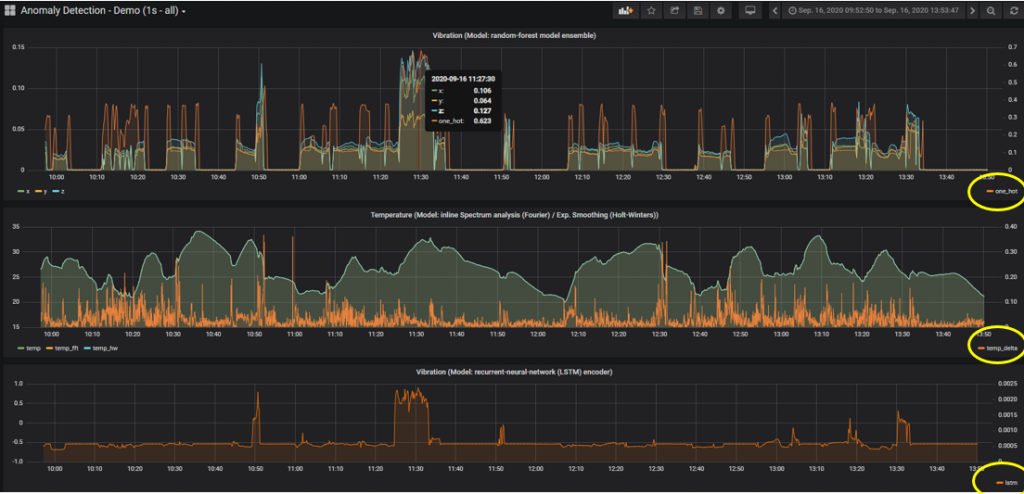
I’ve set up data from a Balluff Condition Monitoring Sensor to be ingested to a time-series database (influxDB) and then plotted in Grafana. In each graph we have an orange line that is the anomaly measurement yielded from the different models. I have just 3 to keep things uncluttered. We can see in this view that the anomaly measurements occur at different points:
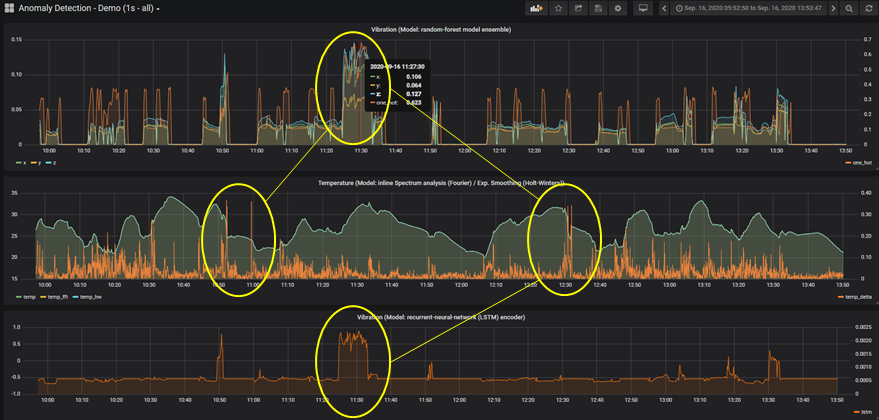
We have a common peak in the graphs top and bottom, but other peaks are indicated by the middle model. By extending the list of models – but at the same time resisting the urge to combine the individual anomaly measurements into some kind of overall “score” – we invite questions about the areas where we see peaks. Is that legitimate behaviour? Does this pattern re-occur? Do we need to train our models on data that is more representative of such modes? Etc. etc. In keeping our black-box “open”, we do not eliminate or filter out information that may be useful in the long term. We may well be looking for a needle in a haystack. However, this approach will help us to minimize the amount of hay we need to search!
This article is based on a talk recently given at the Industry-Forward Expo event.
Further reading
The six mistakes executives make in risk management.
Why Gaussian statistics are mostly wrong for strategic organization.
The worst forecasting failures and what we can learn from them.
Fixed time descriptive statistics.